ELK!
ELK stands for ElasticSearch, Logstash and Kibana.

ElasticSearch
ElasticSearch is the place where the data is stored, It is a NoSQL database based on Lucene search engine which is used to store and search data. It is responsible for providing all the search and analysis results. It receives data from resources like Logstash, Beats (Filebeat, Metricbeat), etc. You can even import data directly to ElasticSearch with the help of curl. Elastic search stores all the data in structured JSON format. You can map and index data into ElasticSearch, not only that Elasticsearch is so wide that it supports alot many API for easy use. IF you want to import lots of data into Elasticsearch then you can do so by using "bulk API'. Elastisearch even have libraries and API in so many languages such as Python, Java, JavaScript and so on.
Logstash
Logstash, which is in the front, is responsible for giving structure to your data (like parsing unstructured logs)
and sending it to Elasticsearch. It collects data inputs and feeds it to the Elasticsearch. It collects various types of data from different sources, all at once and makes it available immediately for further use.
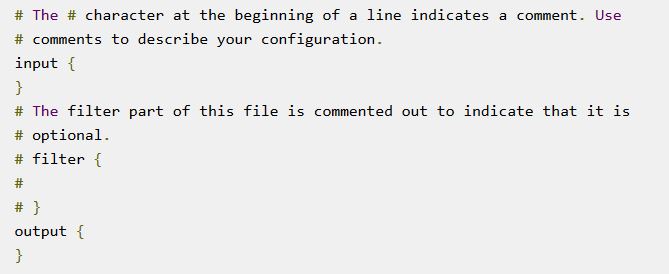
Logstash have three fields mainly - input, filter and output.
Here, input field is used to give inputs to the logstash, inputs can be given in different ways. You can use Filebeat,
Collectd (To collect system metrics) or even directly input from a log file.
filter defines which logs should be transferred to Elasticsearch, you can even remove filter field if you want to parse all the logs to ElasticSearch.
output field is used to tell logstash where it should send all the data. It can send data to a file, ElastciSearch, etc.
Logstash helps a lot when you do not want to mess with all the mappings, converting data to json format and then importing
it to Elasticsearch with the help of curl.
Kibana
Kibana lets you visualize your Elasticsearch data and navigate the Elastic Stack. Kibana is an open source analytics and visualization platform designed to work with Elasticsearch. You use Kibana to search, view, and interact with data stored in Elasticsearch indices. You can easily perform advanced data analysis and visualize your data in a variety of charts, tables, and maps.
Now, all the data (Logs) which are present in Elasticsearch needs to be visualized for a better understanding. Kibana is there just for that purpose, with Kibana you can plot visualizations such as Bar graphs, Pie charts, maps, timelion (timeseries), etc. Kibana is easy to learn and you can even create dashboards for all the visualization and group them together. Kibana Xpack also supports Machine Learning in which you can get timeseries anomaly detection and much more.

